 Research Article
An Operational Analysis of Micromagnetic Emission Response of a Mild Steel to Various Mechanical and Physico - Chemical Influential Factors
AF Altzoumailis1*, VN Kytopoulos2 and SN Katsantonis1
1School of Chemical Engineering, National Technical University of Athens, 5, Heroes of Polytechnion Avenue, 15773 Athens, Greece
2School of Applied Mathematical and Physical Sciences, National Technical University of Athens, 5, Heroes of Polytechnion Avenue, 15773 Athens, Greece
AF Altzoumailis, School of Chemical Engineering, National Technical University of Athens, 5, Heroes of Polytechnion Avenue, 15773 Athens, Greece.
Received Date:March 27, 2023; Published Date:April 13, 2023
Abstract
In this study certain suitable-relevant operational – reference parameters of micromagnetic emission are introduced by which the obtained experimental data may quite practically and easily be compared and monitored. As such, by using a pulse-height distribution (PHD) - integration measuring technique, it was possible to construct, in advance, the presumed initial form of PHD function related to the material. Based on this fact, a correlated power-height distribution (WHD) function was proposed. These functions have helped to introduce certain useful micromagnetic intensity parameters and relationships, by which, finally, the experimental results could conveniently be analyzed and discussed. In this way, it was possible to demonstrate that the obtained findings, concerning the influence on the material of plastic deformation and certain physico-chemical factors, such as hydrogen accumulation and isothermal heating, are in reasonable agreement with related findings in the existing literature. For instance, plastic deformation, under certain given conditions, may increase or decrease the measured micromagnetic activity. Hydrogen accumulation due to its peculiar mechanisms, tends to reduce the micromagnetic activity, while isothermal heating, due to its segregation phenomena, also reduces the activity. Both factors lead to a magnetic hardening as well as embrittlement of steel.
Keywords:Specific micromagnetic intensity; Pulse-power height distribution; Changeover range; Domain wall; Magnetic anisotropy; Plastic deformation; Hydrogen; Isothermal heating; J-parameter
Introduction
There are inseparable connections between degradation of mechanical and microscopical integrity and properties of material related to their applications on several industrial fields. Material degradation, in general, is a crucial, inherent problem in every kind of industrial praxis. Therefore, the investigations of reasons for degradation lead to the development of possibilities for suitable prevention and protection attempts, which would be very important for each industrial society. In other words, the characterization and +evaluation of material degradation by non-destructive techniques should play a strong demand in all kinds of industries. For instance, the investigation of environmental degradation factors, such as hydrogen-induced stress corrosion cracking (cathodic stress corrosion), and embrittlement is of a prime interest [1-10]. Particularly, endangered are weldments in vessels and tubing’s under high pressure and oil environments, where in–service loading favors the stress corrosion cracking phenomena. With re spect to this, it is mentioned that non-destructive micromagnetic techniques, such as Micromagnetic Barkhausen Emission (Noise), (MBE), react with respectable sensitivity to active on-load and residual (passive) stress gradient changes [9,11-14].
In this aspect, the dynamics of domain wall motion and consequently the nature of MBE are sensitive to various microstructural features such as grain size und boundaries, density and distribution of dislocation arrays, precipitations, stress gradients and microcracking [15-20]. This sensitivity makes the MBE-technique a prime candidate for assessing the mechanical degradation conditions. However, because of the large number of influential factors and variables, this technique produces only very relative comparisons between different material states. Moreover, in most MBE-measurements a single parameter is obtained from each signal envelope, e.g. peak height, peak position (location), root-mean-square- (r.m.s) voltage, count rate etc. While these parameters are useful for various correlations, they are limited in that that may seriously obscure many crucial information necessary for a correct interpretation of data.
Today, despite extensive research in the field of deformation and corrosion – induced degradation of materials microstructural magnetic and mechanical integrity, a full understanding of the related phenomena is not yet possible. In view of all the above mentioned, the present work reflects a further attempt of those made by the authors in previous studies [21-25], for a comprehensive and analytical characterization of a mild steel, concerning its micromagnetic emission response to various mechanical and physico-chemical influential factors. For this reason, certain suitable operational micromagnetic parameters are introduced, by which the obtained experimental data may conveniently be monitored and discussed.
Experimental
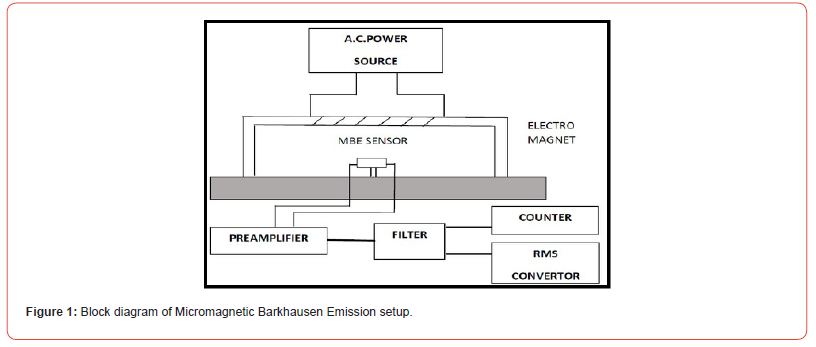
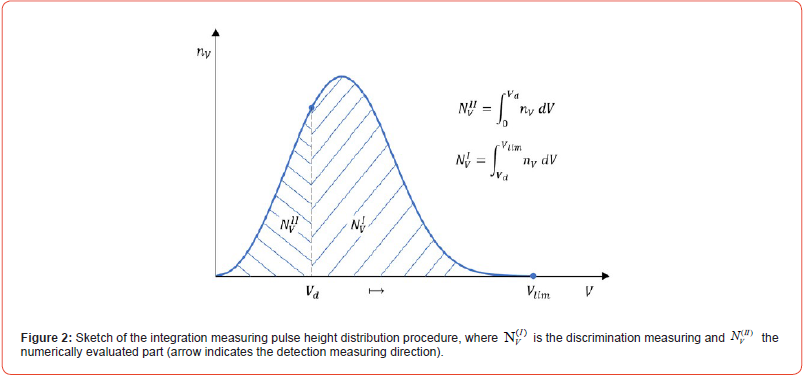
The investigated specimens, of a low-carbon steel, were subjected to various kinds of microstructural degradations. Firstly, mechanical degradation was introduced by on-load, as well as off-load, plastic deformations. Secondly, the physicochemical degradation was introduced by two distinct factors: hydrogen accumulation in NaCl-water solution as well as isothermal heating in air. More details about the respective specimen preparation may be found in [21-25]. The specimens were magnetized using a U-shaped electromagnet head, which was attached to the specimens. Barkhausen emission was detected by using a search coil with 4000 turns wound around a ferrite core. A function generator producing a 10 Hz-oscillating triangular wave form was used to exit the search coil of the pic-up probe. Only voltages higher than a selected threshold of ± 20 mV were taken for Barkhausen analysis. The output of the detector was fed to a pre-amplifier of a gain of 2000, and through a respective band-pass filter (1-100 kHz). Data were collected and analyzed on a PC digital oscilloscope board. It is pointed out that the amplitude or strength of magnetic field sweep was chosen suitably high enough, in order to be able to take the specimen from upper limit to lower limit of magnetic saturation, i.e. from +65 Oe to -65 Oe. In Figure 1, the basic principle of Barkhausen set-up of the present measurements is demonstrated. Furthermore, in Figure 2, the essential of integration measuring principle of the presumed PHD is shown. Here it is:
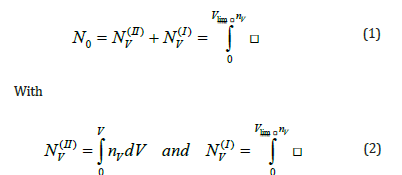
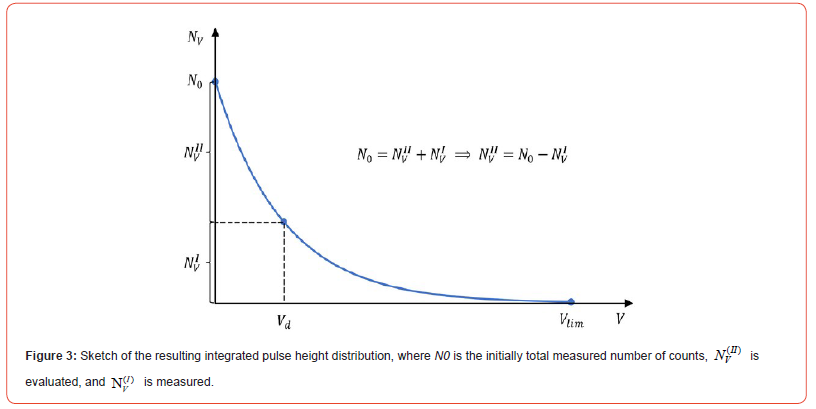
It should be pointed out that the experimental determination of the limiting voltage, lim V is coupled with considerable uncertainties and consequently we prefer to use the integrated part, NV(II) , of the PHD, as shown in Figure 3. As explained in [26] and in view of the afore-mentioned, it is noted that the presented experimental PHD integration measuring technique reflects several advantages over the common differential measuring set-up technique of the basic PHD determination. Consequently, this was one of the main reasons for using the first technique. This technique consisted, in short, in the following procedure: the counter (energy) measuring module of Barkhausen apparatus was set to work as an energy discriminator or screening factor. As such, it is used to select and transmit the counts (pulses) within a predetermined voltage range for further processing. This was achieved by selecting variable sets of threshold base line voltage or energy discrimination levels.
Theoretical Consideration
As mentioned earlier, the scope of the present operational study is to try to establish certain relationships of basic physical reference states of micromagnetic activity by which the experimental data, obtained by MBE measurements, can practically and conveniently be compared and analyzed. One of such a state may be expressed by the PHD function which can theoretically be presumed and approached by the trial-and error estimation procedure given in more details in Appendix-A. Thereafter, the proposed- presumed – initial PHD function results to be of the form:

After a closed-form integration of this function, one obtains:

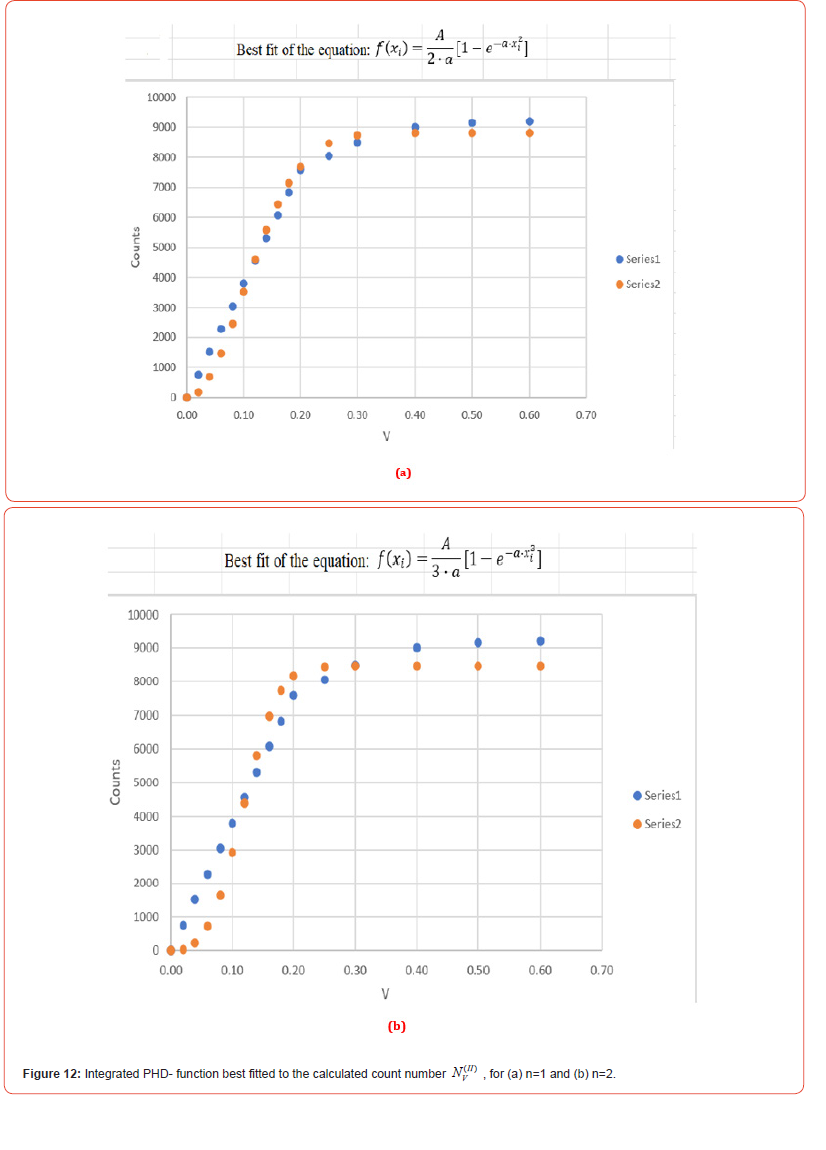
Thus, as explained in the experimental section by Figure 2 and Figure 3 and also in Appendix A, the related experimental data obtained by a PHD-integration measuring procedure, were best used for fitting the function (4) for the evaluation of the constants A and a, needed in function (3) .The second proposed reference function results to be, as shown in Figure 2 and Appendix-A, a power- height distribution of the form:

Here mV=μV∙nV is the total-effective mass of domain walls moving with the same velocity determined by its associated voltage V . Furthermore, it can be assumed that μV may express the effective mass of the individual domain walls moving with the same velocity also determined by its related voltage V. Now, based on the above introduced reference functions (3) and (4) we may define a concrete – reference state, [nmax,Wmax] , of comparison in which a maximum degree of intensity of micromagnetic activity prevails. In this state, nmax is the maximum (peak) value of the nV function of PHD, while Wmax, the maximum (peak) of the WV function of power-height distribution (WHD). In other words, one can argue that in this reference state a maximum number of domain walls, moving at a given instant time with the same velocity, should contribute, at the same instant time, to the maximum power of the micromagnetic activity.
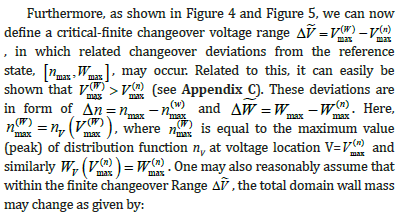
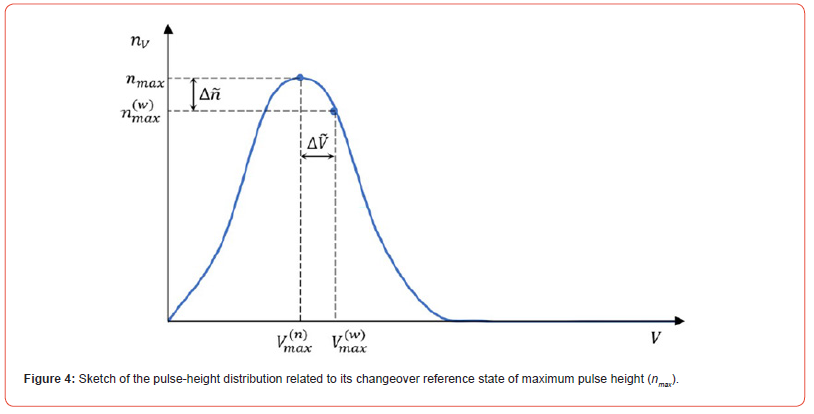
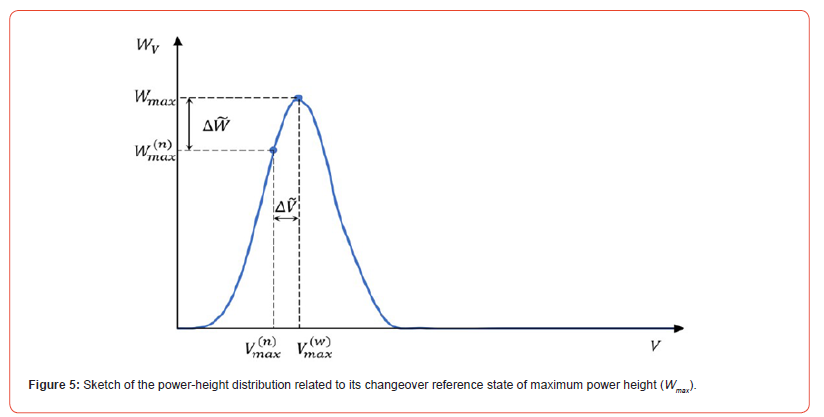
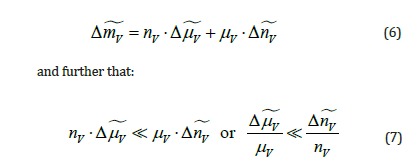
This means that, within the finite changeover range ΔV , the rate of change of the effective mass μV, of the individual domain walls should be negligible compared to the rate of change of the corresponding number of domain walls, nV. Consequently, mv= const ⋅ nv =(μv=const).
Results and Discussion
By means of the obtained experimental data and introduced relationships, we have calculated certain useful specific parameters, shown as follows:
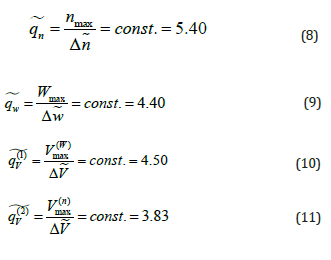
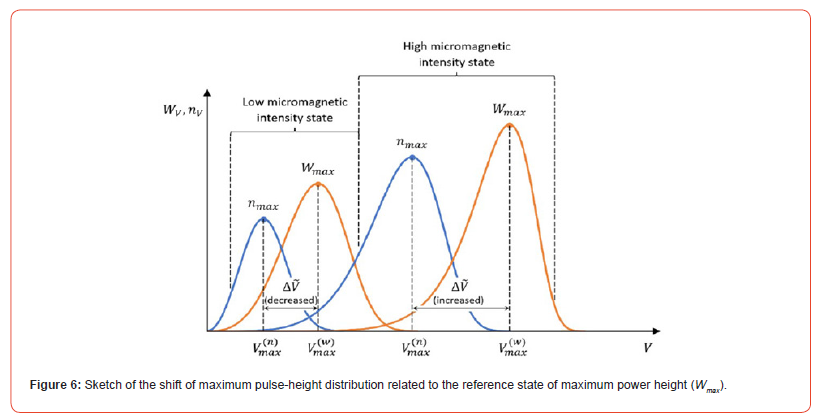
Based on these parameters, one can postulate as follows: a reduction (or an increase) in the changeover range ΔV imposes an analogical reduction (or increase) in the peak height (maximum), as well as peak position, value of the related distribution. Furthermore, one can easily see that for V Δ →0, follows: n Δ →0, ΔW →0, Wmax→0, nmax→0, Vmax (W) →0 and Vmax (n)→0. From the view of thermodynamic equilibrium, this would mean, perhaps, that the critical reference state [ ] max max n ,W , under these conditions, is not attainable. Consequently, the proposed changeover voltage range ΔV could be used as a useful measure of changes in the intensity of micromagnetic activity. This fact is described schematically in the crucial Figure 6, where a reduction (or increase) in the ΔV , tends to shift the peak height, as well as peak location, of both distributions to lower (or higher) values. Thus, this behavior imposes an associated reduction or (increase) in the micromagnetic activity in the material.
In Figure 7, the results obtained for on-load, tensile-active plastic deformation are presented. Here, an increase in the plastic deformation causes a continuous increase in the evaluated changeover range ΔV . According to Figure 6, this means that plastic deformation tends to stimulate an increase in the micromagnetic activity – intensity of steel. This fact, primarily, seems to be consistent with other findings [21-25], where micromagnetic activity, expressed by a proposed specific parameter, J, increases with onload plastic deformation. At this place it should be mentioned that this interesting parameter would reflect a specific energetic nature of micromagnetic activity and as such, seems to be almost independent of the given experimental conditions such as of specimen geometry electronic-gain setting, the so-called lift-off effects of measuring electromagnetic pick-up and others [15, 21-25] (more about this parameter in Appendix-B).
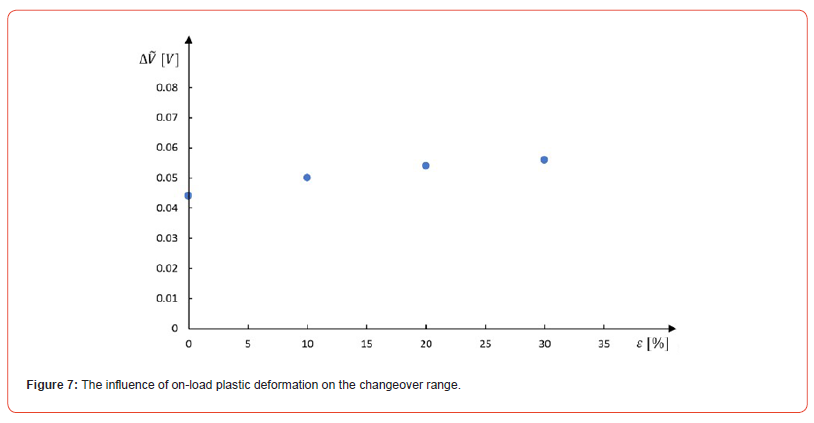
The above results are also substantiated by findings given in [6,11], where micromagnetic activity, expressed by the measured MBE-energy as well as count rate, increases with active plastic deformation. In fact, an applied stress implies that it is energetically favorable, the domain magnetizations, to lie along a cubic easy axis that is closer to the direction of applied stress. At the same time plastic strain produced directional order of dislocation slip results in a complete domain reorganization in the local micromagnetic system. This results in a magnetic stress anisotropy, close to the direction of applied stress. This would lead to an increase in the MBE.
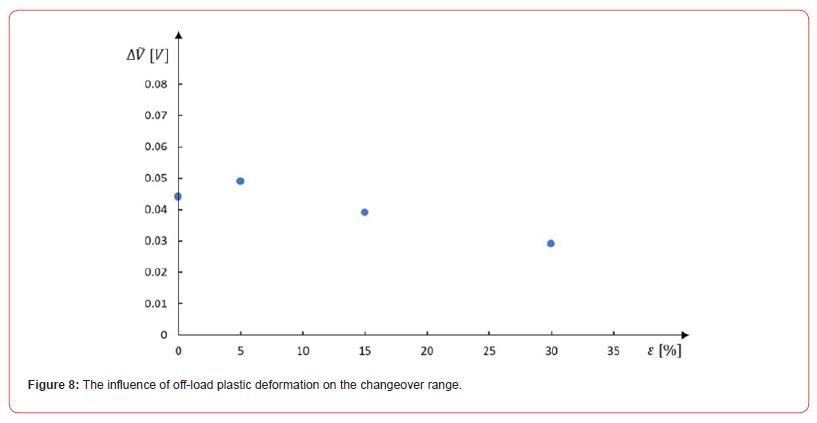
In Figure 8, the tensile, off-load, behavior of passive plastic deformation is presented. Here, in contrast to the Figure 7, an increase in the evaluated changeover range followed by a decrease is observed. According to Figure 6, this should be related to an increase and a decrease in the MBE. This seems to be consistent with the findings in [13,19], but in contradiction with other ones [14], where a continuous decrease of the MBE is observed. It should be noted that in all these reported studies, different metallurgical samples have been used so that a direct and, more or less, correct comparison of their results is not possible. Nevertheless, we would agree with the first mentioned findings, where the given explanations are more convincing. Thus, any changes in the MBE should be explained on the basis of changes in the resultant magnetic easy axis due to plastic deformation. In turn, these changes may determine the stress- induced macroscopic magnetic anisotropy. In polycrystalline materials, however, the produced magnetic anisotropy is rather complicated due to the complex interactions between multiple slip order systems and dislocation arrays. As such, it is not easy to predict the resultant easy axis in these materials. Furthermore, it is well known that if a material is unloaded after tensile plastic deformation, this material experiences residual compressive stresses in the direction of previous deformation [13,19]. These stresses tend to produce an easy axis perpendicular to the direction of previous tensile deformation. This phenomenon leads to a decrease in the MBE, which, according to Figure 6, is evidentiated by an associated decrease in the ΔV . Consequently, the MBE in plastically strained samples, after unloading, will be generally dependent on magnetic anisotropy due to residual stresses caused on plastic straining. Actually, this anisotropy would be superimposed on the above-mentioned slip order-induced anisotropy, giving so a dual anisotropy and hence very complex mechanisms of magnetic easy axis changes. Thereafter, the findings in Figure 8, suggest that at low deformation (5%), there is a change in the mechanisms related to the resultant magnetic anisotropy. This would mean that on straining up to 5%, the resultant easy axis shifted towards the prior tensile axis, which means that slip-order mechanism of anisotropy is dominating in increasing the activity. However, beyond this strain, mechanisms of residual-compressive stress-controlled anisotropy. This would decrease the intensity of micromagnetic activity in the material, which dominates in shifting the anisotropy axis towards a direction perpendicular to prior stress axis.
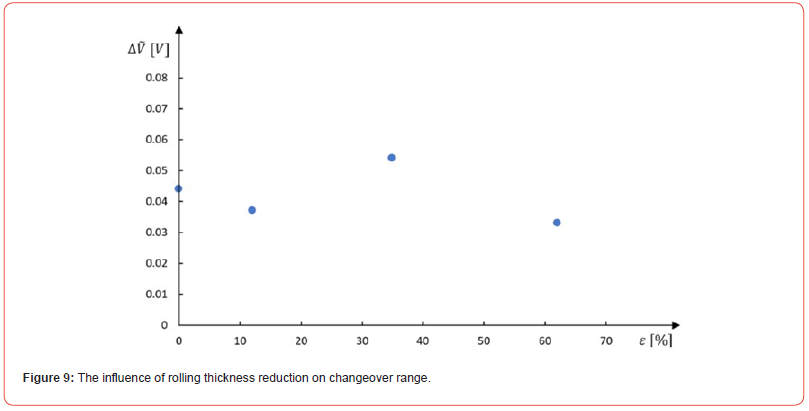
Based on the earlier mentioned, Figure 9 clearly indicates the occurrence of multiple changes in form of maximum and minimum of ΔV – range due to magnetic anisotropy, induced by plastic deformation on rolling. The mechanism of anisotropy formation on rolling, is rather very complicated due to the very complex interactions between crystallographic multiple shear slip systems caused by the combined effect of compression and tensile deformations. Thus, rolling produces more intricate textures and fixes not only a direction parallel to the rolling directions, but also a crystal plane parallel to the plane of rolling. The complex deformation on rolling can be conditionally represented as a result of tension along the rolling axis and of compression in a direction normal to the surface of specimen. In this context, the number of possible slip systems is large, especially in steels, so that more than one orientation usually forms on rolling, i.e. all crystallites are divided in a few groups, each of particular orientation. As such, one of these orientations may occur more often than others, and thus the associated group may include a large quantity of deformed crystallites. From the above-mentioned, one can deduce how difficult may be a correct explanation of results in Figure 9. Thus, only a simple qualitative explanation could be given. Consequently, in Figure 9, the strong interplay between the residual (compression) stress-induced magnetic anisotropy and that induced slip order may be evidentiated. At 12% thickness reduction, the first kind of magnetic anisotropy dominates, fact which according to Figure 6, a minimum of activity is produced. At 35% thickness reduction, the second kind is strongly dominating, giving so, according to Figure 6, a peak-maximum in the micromagnetic activity-intensity. It is noted that multiple changes in the magnetic anisotropy on rolling have also been demonstrated by means of angular distribution measurements of MBE in function of the angle with respect to the axis of prior applied stress [20].
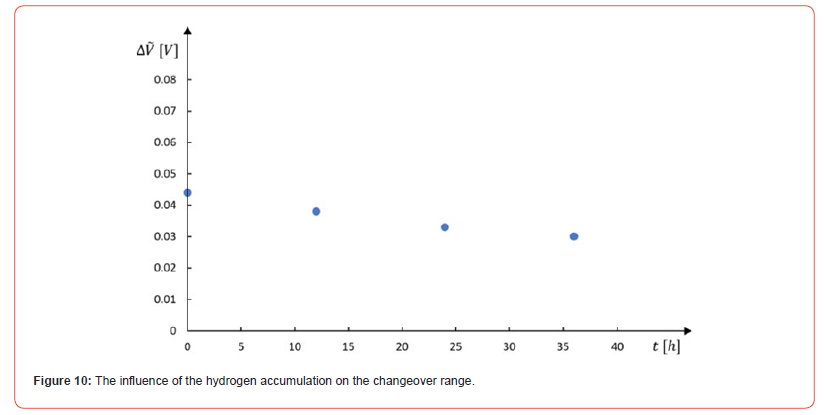
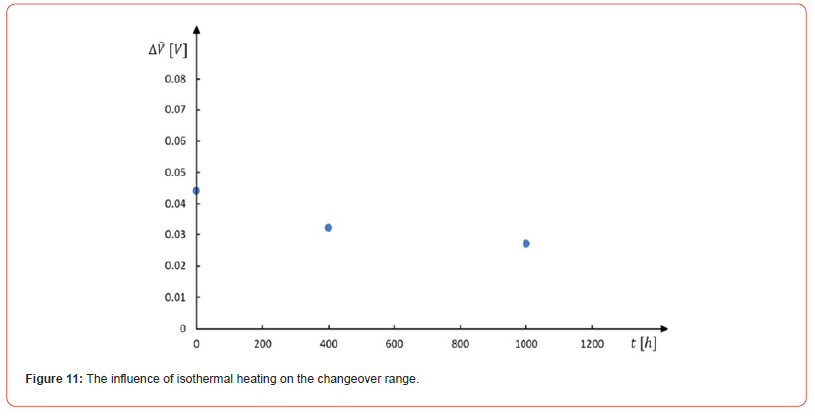
In Figure 10 and Figure 11, the results obtained for specimens, subjected to hydrogen and isothermal heating induced structural degradation are presented. Thus, in both figures and according to Figure 6, a continuous decrease in the measured changeover range in micromagnetic intensity with increasing time of degradation can be observed. These findings are in reasonable agreement with those given and explained in [21-25] by means of the domain wall motion – coupled specific-energetic parameter J (see Appendix- B). Thus, the present results may not be explained on the basis of stress induced magnetic anisotropy, but rather by means of domain wall dynamics, i.e., jumping events between pinning sites of domain walls. In the above cited studies, the hydrogen influence is explained on the basis of localized, combined-opposite effects of hydrogen accumulation, such as stress relief and void coalescence [1]. The first effect favors a decrease in the pinning strength and hence an increase in the intensity of domain wall motion, while the second one a decrease in the intensity by increasing the number of pinning sites. The resulting net effect is related to an associated reduction in the specific energetic parameter J and hence in the micromagnetic activity. In Figure 11, the results concerning the specimens-subjected to isothermal heating at 440℃ are presented. Thus, similarly, to Figure 10 and according to Figure 6, a continuous decrease in the evaluated changeover range in the micromagnetic intensity, can also be observed. The net effect of segregation phenomena of impurities causes a reduction in the J-parameter [25]. In this context, the microstructural degradation may be explained on the basis of domain wall dynamics. Segregation with temper time by most potent embrittling impurities, elements such as phosphorus, tin and arsenic, may increase the strength and number of pinning sites, thus impending the domain wall motion. Consequently, the degradation degree would be reflected by a reduction in the micromagnetic activity, fact connected with a magnetic hardening as well as a temper embrittlement of steel.
Conclusion
The proposed operational analysis and evaluation technique seems to show a convenient way in which the micromagnetic changes in a steel, under the influence of certain factors, can reasonably be monitored, compared, and explained. The introduced parameters and relationships of analytical comparison, such as changeover voltage range and distribution functions, seem to be quite sensitive to the related changes of micromagnetic emission-activity. In this manner, one can show that on-load, active, tensile plastic deformation, due to applied stresses, leads to an increase, while off-load plastic deformation, due to residual stresses, leads to a decrease, followed by a continuous decrease in the micromagnetic activity intensity. These findings are explained on the basis of stress-induced magnetic anisotropy effects. Rolling deformation seems to produce quite large and multiple changes in the resultant magnetic anisotropy. Physico chemical degradation factors such as hydrogen accumulation, due to its peculiar, highly localized - microscopic effects, tend to reduce the micromagnetic emission activity, while isothermal heating, due to related segregation phenomena, tends to reduce this activity. The influence of the physico – chemical factors is explained on the basis of a domain wall dynamics –related to the specific J–parameter. All the above results, seem to be in good agreement with other related ones, found in the existing literature.
Appendix-A
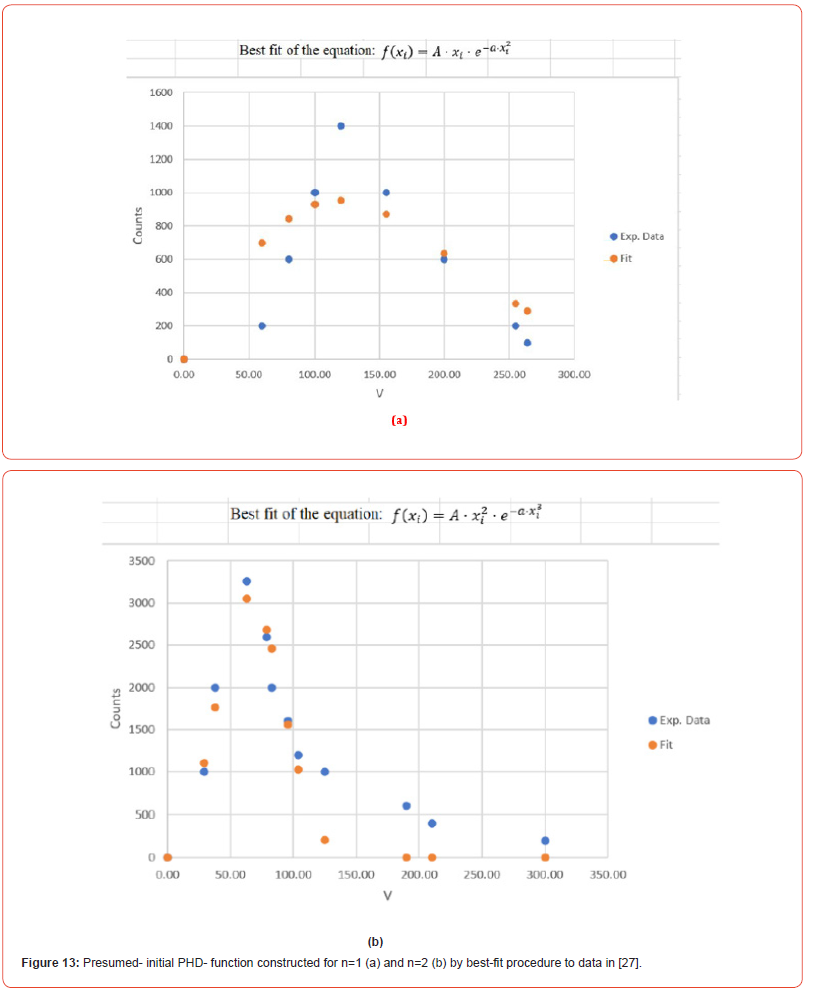
As earlier mentioned, it is suggested to try to find as much as possible a pressured-simple function which may optimally in advance, describe the basic pulse – height-distribution (PHD) of the steel, usually obtained by the common differential measuring set up procedure. The presumed function was found by means of an integrated PHD obtained by an experimental integration measuring procedure. Obviously, such a function should easily be manipulated by a closed-form integration and as such we a general expression of the form:
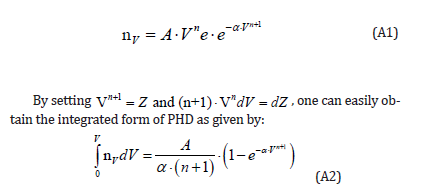
Thus, for n=1,2,3…, we try to find the best approach of this function to the experimental data as given by:

Furthermore, in this aspect we introduce a power – height distribution (WHD)-function as given by:

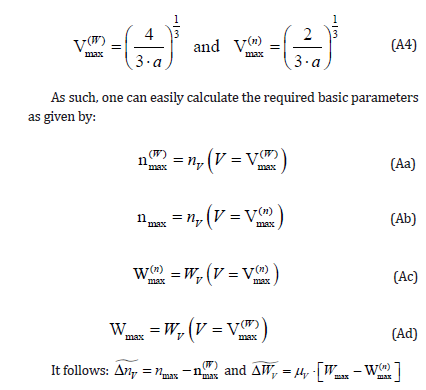
with mV=μV∙nV, as effective total mass of all the domain walls moving within a given changeover voltage interval, ΔV and within the Δ∂ velocity, expressed through voltage V. Furthermore, μV is defined as the effective mass of an individual domain wall moving within the given intervals (range) ΔV and Δ∂. Thereafter, due to the simplicity of the proposed functional approaches, one can easily find for the basic needed parameters:
Appendix-B
For sake of completeness and consistency concerning the mentioned domain wall coupled J parameter, it should be added that the total work of domain wall done against pinning forces would be proportional to the change in the magnetization. In turn, pinning forces may act against irreversible rotation, jump and bulging motions. Consequently, the total induced rms-voltage signal, for a given time period, consists of three basic distinct parts: V(1) rms , due to jump event rate N1; V(2) rms , due to rotation event rate N2 and V(3) rms , due to bulging-controlled event rate N3. By the way, it is noted that an important parameter commonly used is the event energy. This is proportional to the square of signal amplitude and hence provides a weightage to strong events. As such, the root-mean–square voltage (r.m.s.) is closely related to the energy rate of the activity.
Thus, with progressive plastic deformation the partial contribution of rotation and bulging type signals to the total signal increases, because of the production of high density of dislocation tangles, mostly within the nodal walls – sites of forming cell network. This fact leads to an increase in the pinning forces at these sites and hence to a temporarily strong immobilization of domain walls. As such, an increasing part of magnetization is forced to occur by rotation and bulging-controlled events. Thereafter, one can reasonably assume that

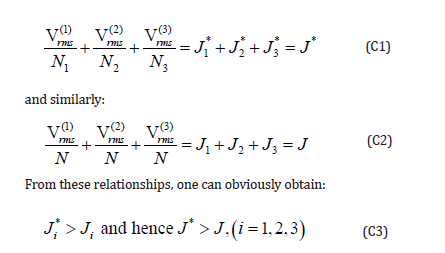
These findings would mean that the specific parameter J, mentioned in this study and proposed and used in the cited ones, should in reality represent a lower limiting value of an “inherent”, “hidden”, specific energetic parameter J*. In other words, the latter parameter seems to reflect an optimally averaged energetic value lying closer to the existing true one. By the way, it should also be mentioned that both of the above discussed specific parameters exhibit the interesting properties of being almost independent of various measuring pic-up conditions and specimen geometry [15, 21-27].
Appendix-C
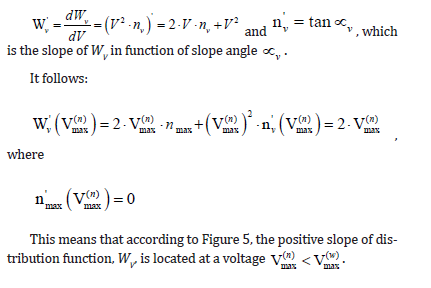
One can differentiate as follows:
Acknowledgement
None.
Conflict of Interest
No conflict of interest.
References
- Briant CL (1985) Metallurgical Aspects of Environmental Failures. Materials Science Monographs 12: 1985.
- Das AK (1996) Metallurgy of Failure Analysis. McGraw – Hill.
- Hertzberg RW (1989) Deformation and Fracture Mechanics of Engineering Materials, 3rd, e.g.
- Yonco Kikua, Takao Araki, Toshio Kuroda (1978) Analysis of Fracture Morphology of Hydrogen – assisted Cracking in steel and its Welds’ in Fractography in Failure Analysis, ASTM STP 645, B.M. Strauss and W.H. Cullen jr, eds, pp. 107-127.
- Meyn DA, Bayles RA (1987) Fractographic Analysis of hydrogen- assisted cracking in Alpha- Beta Titanium alloys. in Fractography of Modern Engineering Materials, Composites and Metals ASTMSTP 948, P400, Masters/Au, Eds.
- Ioakeimidis EK, Kytopoulos VN, Hristoforou E (2013) Investigation of magnetic, mechanical and microfailure behavior of ARMCO-type low carbon steel corroded in 3, 5%NaCl-aqueous solution. Mat Sci and Eng A 583: 585-592.
- Michihiko Nagumo, Kenichi Takai (2019) The predominant role of strain-induced vacancies in hydrogen embrittlement of steel: Overview. Acta Materialia 165: 722-733.
- May L Martin, Mohsen Dadfarnia, Akihide Nagao, Shuai Wang, Petros Sofronis (2019) Enumeration of the hydrogen – enhanced localized plasticity mechanism for hydrogen embrittlement in structural materials. Acta Materialia 165: 734-750.
- Höller P, Dobman G (1989) Conference Symposium on non-destructive monitoring of materials properties. 1988. Boston published: Materials Research society, (MRS), pp. 105-118.
- Jingwei Zhao, Young Soo Chun, Chong Soo Lee (2011) Hydrogen Embrittlement of low Carbon H S .L. A Steel during slow strain Rate Test ‘Advanced Mat. Research 147-193: 642-645.
- Krause WT, Clapham L, Pattantyus A, Atherton DL (1996) Investigation of stress-dependent magnetic easy axis in steel using magnetic Barkhausen noise. J Appl Phys 79(8): 4242.
- Stefanita CE, Clapham L, Atherton DL (2000) Subtle changes in magnetic Barkhausen noise before the macroscopic elastic limit. J Mat Så 35: 2675-87.
- Dhar A, Clapham L, Atherton DL (2001) Influence of uniaxial plastic deformation on magnetic Barkhausen noise in steel. NDT & E – International 34: 507-514.
- Sullivan DO, Cotterell M, Tanner DA, Mészáros I (2004) Characterization of ferntic stainless steel by Barkhausen techniques. NDT & E – International 37(6): 489-496.
- Saquet O, Chicois J, Vincent A (1998) Barkhausen noise from plain carbon steels: analysis of the influence of microstructure. Mat Så and Engineering A 269(1-2): 73-82.
- Baldev B, Jayakumar T, Moorthy V, Vaidyanathan S (2001) Characterization of microstructure, deformation and fatigue damage in different steels using magnetic Barkhausen emission technique. Russian Journal of Nondestructive Testing 37(11): 789-798.
- Blow M, Evans JT, Shaw AB (2007) The effect of microstructure and applied stress on magnetic Barkhausen emission in induction hardened steel. J Mat Så 42: 4364- 4371.
- Yamaura S, Furuya Y, Watanabe T (2001) The effect of grain boundary microstructure on Barkhausen noise in ferromagnetic material. Acta Mater 49: 3019-3027.
- Lindegren M, Lepistö T (2001) Effect of prestraining on Barkhausen noise VS. Streets relation. NDT & E – International 34: 337-344.
- Stefanita CG, Atheron DL, Clapham I (2000) Plastic versus elastic deformation effects on magnetic Barkhauen noise in steel. Acta Mater 48(13): 3545-51.
- VN Kytopoulos, A Altzoumailis, Chr. Panagopoulos, Chr. Riga (2020) Investigation of certain mechanical and magnetic properties of a stressed low – carbon steel after corrosion in NaCl – water solution. Procedia Structural Integrity 26: 113-119.
- AF Altzoumailis, VN Kytopoulos (2021) Characterization of a mild steel by its mutual Tensile Mechanical and Micromagnetic emission response after corrosion in NaCl – water Solution: a combined semiquantitive approach. INTERNATIONAL JOURNAL OF MATERIALS, Vol. 8.
- AF Altzoumailis, VN Kytopoulos (2021) On Novel Aspects of Hydrogen Effects on Applied Stress - Coupled Micromagnetic Activity in a Mild Steel after Exposure to NaCl – Water Solution: A Combined Approach. INTERNATIONAL JOURNAL OF MATERIALS, Vol. 8.
- AF Altzoumailis, VN Kytopoulos (2021) Characterization of Cumulative Hydrogen – affected low – carbon steel by its Mechanical and Magnetic Barkhausen emission response; a semiquantitive combined approach, INTERNATIONAL JOURNAL OF MATERIALS 8: 11-29.
- Alexandros F Altzoumailis, V Kytopoulos (2022) Microstructure- assisted changes in the magnetic Barkhausen emission of a mild steel under the influence of various mechanical and environmental loading factors; a semiquantitive analysis. WseasTransactions on Electronics 13: 52-66.
- AF Altzoumailis, VN Kytopoulos, “A Study of Stress – Induced Subtle Magnetic Changes in a Mild Steel Using Barkhausen Emission-Aided Analysis Approaches”. Submitted for publication to the journal WSEAS Transactions on Electronics.
- VN Kytopoulos: “Unpublished data”, Laboratories of Metallography and strength of Materials, NTUA – Greece.
-
AF Altzoumailis*, VN Kytopoulos and SN Katsantonis. An Operational Analysis of Micromagnetic Emission Response of a Mild Steel to Various Mechanical and Physico - Chemical Influential Factors. Glob J Eng Sci. 11(1): 2023. GJES.MS.ID.000754.
-
Specific micromagnetic intensity, Pulse-power height distribution, Changeover range, Domain wall, Magnetic anisotropy, Plastic deformation, Hydrogen, Isothermal heating, J-parameter
-

This work is licensed under a Creative Commons Attribution-NonCommercial 4.0 International License.


